I thought I would mention a very simple concept that I know a lot of traders know of, but there may be some who don't. The concept is of chart correlation, i.e. when one pair goes up, another pair goes down.
This concept is especially true for all the majors and there is a very simple reason why. All the majors have one thing in common, the USD, in general it is the USD that drives the pairs up and down, there are of course the odd exception with region specific data releases etc, but as a whole it is the USD that drives things. So if the USD gets stronger, then more than likely the USD/JPY will rise, while the EUR/USD will fall. Don't believe me? Let's look at some charts I have prepared earlier ;), I have overlayed and coloured them to make them easier to compare:
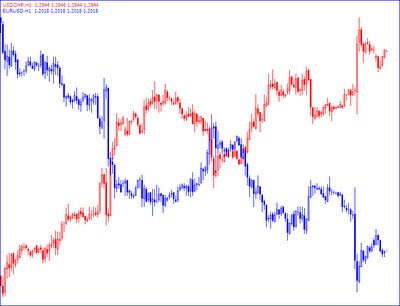
EUR/USD 1H over the USD/CHF 1H

You can see they are practically mirror images of each other. Now how about two pairs with USD as their base currency, lets look at the EUR/USD again but against the GBP/USD:
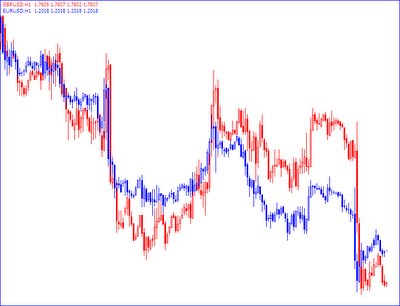
EUR/USD 1H over the GBP/USD 1H

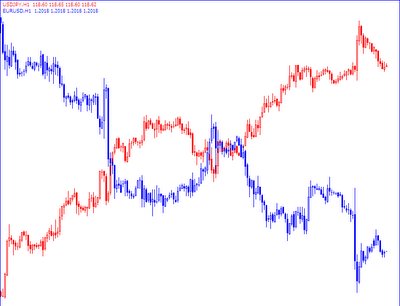
You can see they play follow the leader for most of the time. You can see then that most of the time, it would be contradictory to have a swing trade short on the EUR/USD and a short on the USD/CHF at the same time, one is doomed for failure. You can compare all the majors and the action is essentially the same, here is the EUR/USD over the USD/JPY:
EUR/USD 1H over the USD/JPY 1H

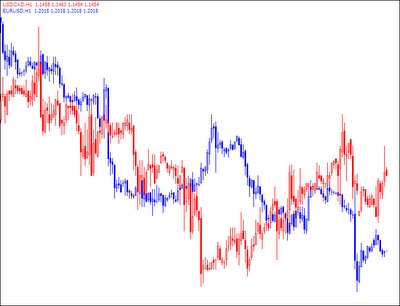
I think I have made my point. There is however the odd exception, although not amongst the majors, currently that "black sheep" is the USD/CAD. You would expect, with the USD as it's base also it should follow the pattern of the USD/JPY and the USD/CHF, but, as it is a commodity and energy reliant pair, and considering the current energy crisis the world is under, the USD/CAD currently is leading it's own life. Here is the EUR/USD over the USD/CAD to show you what I mean:
EUR/USD over the USD/CAD


You can see, apart from the new year action that for quite some time the USD/CAD bucked the trend, and moved in the same direction as the EUR/USD as demand for oil prices rose, gold hit new 5 year highs and the canadian economy was going great guns. If you have a charting package that let's you overlay charts, then it is well worth doing every now and then to see how pairs are moving compared to others, it just may stop you trading against yourself.
Happy trading!
please read related articles :
http://forexandtrading24.blogspot.com/2010/06/theory-indicator-types.html
http://forexandtrading24.blogspot.com/2010/06/theory-forex-101.html
http://forexandtrading24.blogspot.com/2010/06/theory-fibonacci.html
Happy trading!
please read related articles :
http://forexandtrading24.blogspot.com/2010/06/theory-indicator-types.html
http://forexandtrading24.blogspot.com/2010/06/theory-forex-101.html
http://forexandtrading24.blogspot.com/2010/06/theory-fibonacci.html
No comments:
Post a Comment